
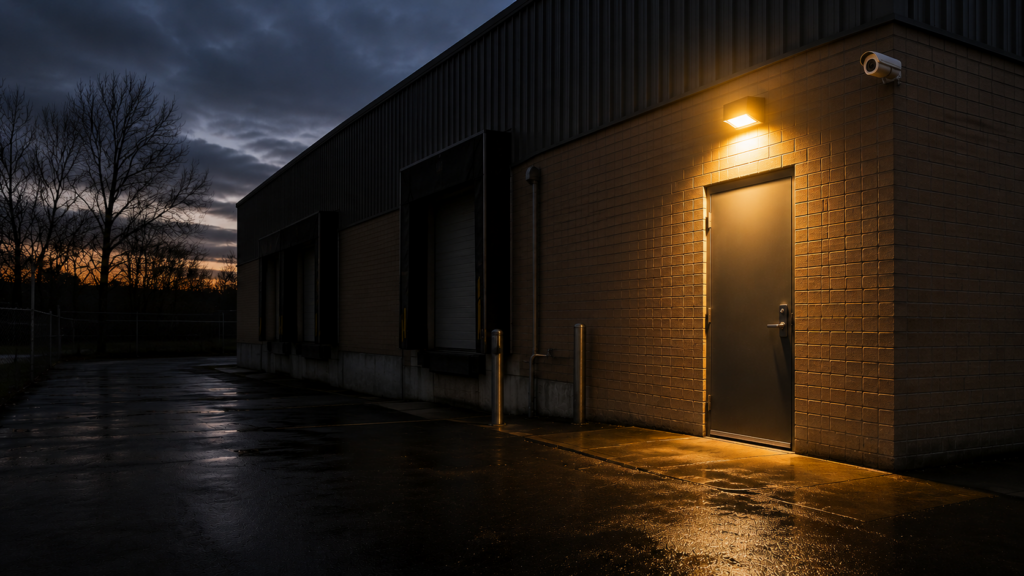
Break-In Statistics for Michigan Businesses
Most owners judge their break-in risk by the last thing that happened nearby. A store down the street gets hit, and the phone rings. Six quiet months go by, and the security line vanishes from the budget.
The data tells a steadier story. A steadier story is easier to plan around.
The FBI released its 2025 crime numbers in August 2026. They are the newest figures available, and they are striking. Here is what they say about break-ins, what the Michigan picture looks like, and what both mean for your building.
Break-ins just hit a 20-year low
The 2025 numbers moved hard in one direction. All of the figures in this section come from the FBI’s 2025 crime report.
Break-ins fell 15.8 percent in one year. That is the estimated national drop from 2024 to 2025. Property crime overall fell 12.4 percent.
The rate is the lowest in 20 years. Break-ins dropped to 193.6 per 100,000 people, under 200 for the first time in two decades. It was 231.0 the year before.
Every kind of community saw a drop. Suburban areas fell 17.8 percent. Metro counties fell 15.5 percent. Mid-size cities of 50,000 to 100,000 people saw the biggest drop of all at 22.8 percent. That last group covers a lot of Michigan.
The scale is still large. Police agencies logged 580,454 break-in incidents in 2025 through the detailed reporting system, with 673,424 victims behind them.
So the trend is genuinely good. Here is the part that has not improved.
Almost nobody gets caught
Police cleared just 17.4 percent of reported property crimes in 2025. For violent crime the figure was 47.4 percent.
That is up slightly from 15.9 percent the year before. It is still roughly one property crime in six.
Sit with that for a second. You are not getting your property back. Prevention carries almost the whole load.
A security budget built on the hope of catching someone later is built on the wrong idea. That was true when break-ins were rising, and it is still true now that they are falling.
The Michigan picture
Michigan’s own numbers for 2025 are not published yet. The most recent state breakdown is 2024, so treat these as the baseline the 2025 decline is measured against.
Michigan logged 141,493 property crimes in 2024. Break-ins made up 13.4 percent of them. That is close to 19,000 buildings entered in one year.
Two Michigan facts are worth holding side by side:
- Property crime here runs 21.7 percent below the national average.
- Violent crime here runs 20.9 percent above it.
So a national headline will mislead you in either direction. Pull the Michigan number instead.
The state was already trending down before the national 2025 drop. Michigan’s overall crime rate fell 10.2 percent from 2023 to 2024.
Want the figure for your own city? The Michigan State Police post it in the Crime in Michigan dashboard. You get full-year data plus current-year updates every quarter, which is where Michigan’s 2025 figures will land first.
The real cost is not the stolen goods
Loss figures only count what walked out the door. They miss what the night actually costs you:
- The forced door or the smashed storefront glass
- The board-up and the rush repair
- Days of slow or stopped business
- Your insurance deductible, and what the claim does to next year’s premium
- Staff hours lost to reports, claims and cleanup
- Customers who drove past a boarded window and kept going
For most small and mid-size businesses, the stolen goods are the smallest line on that list.
A daytime break-in at a business took $4,889 in property in 2023, the last year the FBI broke that figure out by building type. The disruption almost always costs more than that.
That changes the budget math. You are not weighing a security bill against a rare, modest loss. You are weighing it against a shutdown.
When break-ins happen
The 2025 data includes something useful. It breaks the day into four blocks instead of just day and night.
Here is when break-ins were reported in 2025:
- Afternoon, noon to 6 p.m.: 161,764
- Overnight, midnight to 6 a.m.: 141,695
- Morning, 6 a.m. to noon: 129,211
- Evening, 6 p.m. to midnight: 122,641
Afternoon led the count. The four blocks are closer together than most people would guess, and the spread from highest to lowest is under 40,000.
So be careful with the old claim that break-ins are almost all nighttime. That figure covers homes and businesses together, and the FBI does not split time of day by building type. But the shape of it is clear enough. There is no safe window.
What we do know about your building is simpler. It sits empty and unwatched after hours. That window still needs its own plan, even if it is not the only one.
Weekends and holidays stretch the damage. The gap between the break-in and the moment you find it goes from hours to days. A Friday night entry found Monday morning gave someone the whole weekend.
Winter darkness matters more here. Detroit loses usable daylight before 5:15 p.m. for much of November, December and January. Northern Michigan goes dark even earlier. That is about five months a year with a longer risk window. November and December need a different plan than June does.
Which Michigan businesses get hit
Risk is not spread evenly. The FBI does not rank break-ins by business type, so this list comes from industry loss reports and our own assessment work around the state:
- Retail, especially small stores holding goods that resell fast
- Construction sites, for tools, equipment and copper
- Warehouses, for pallet loads of resalable goods
- Auto dealers and repair shops, for parts, converters and vehicles
- Restaurants and bars, for cash and liquor
- Empty or half-empty buildings, for copper, wiring and mechanical equipment
That last group is growing fastest in Southeast Michigan. An empty building has nobody inside, often no live alarm account, and valuable metal in the walls.
How they actually get in
Most break-ins are simple. Four patterns cover almost all of them:
- A forced rear or side door, out of sight from the street. This is the most common way in. It is also the easiest to stop.
- Broken glass at a storefront or ground-floor window.
- Roof access on standalone buildings, using a ladder, a dumpster or pallets stacked nearby.
- An open door that was unlocked, propped or never latched.
Pattern four is bigger than most owners guess. In 2024, the last year the FBI published entry method, unforced entry accounted for roughly 38 percent of break-ins with a known method. Forced entry led at 397,867 cases.
Nothing suggests that mix changed in 2025. And pattern four is the cheapest one to fix.
No camera catches it either, because nothing about that entry looks odd on video.
Getting hit once makes a second hit likely
This is the pattern owners underestimate most. A building that gets hit once is far more likely to get hit again. The second one often comes within weeks.
It is one of the steadiest findings in crime research, and a falling national rate does nothing to change it.
A Home Office study by Ken Pease and Graham Farrell found that a small group of victims absorbs a huge share of all crime. About 4 percent of people account for roughly 40 percent of it in a year, and repeats often land within a week. British survey data in the same work found 7 percent of burglary and vehicle crime victims were hit three or more times in one year.
Dutch researchers tracked six years of police records and found the same thing, plus the timing detail that matters most. The odds of a repeat are highest right after the first break-in, then fade as time passes.
Why? The first break-in taught someone three things. Your building can be opened. Help takes a while. What is inside is worth taking.
That knowledge does not expire.
So the days right after a break-in are the riskiest your building will ever see. The plywood is still up. The alarm zone may still be bypassed. The repair is booked for next week.
Here is what to do in that window:
- Fix the actual breach now instead of boarding it and waiting
- Take that alarm zone off bypass
- Add temporary coverage at the spot they used, including a mobile unit if the permanent fix will take time
- Add light at that location
- Assume they will try the same way in again, and close that specific gap
Owners who call the first break-in bad luck and the second one unbelievable are usually describing something predictable.
What actually lowers your risk
Here is the list, roughly in order of value per dollar.
Lighting. Dark rear doors and loading areas are the most targeted spots on any building. Aim for even light across the whole perimeter, not bright pools with dark gaps between them. Good light makes every camera you already own work better. It is usually the cheapest fix available.
Door discipline. Put position sensors on every exterior door. They tell you when a door is propped or fails to latch. Since unforced entry is close to four in ten break-ins, this closes the biggest fixable gap you have.
Cameras on the approach. Point them along the way in. Mount them at eight to ten feet. You want a face on the walk up, not a hood at the door.
Monitored alarms. The siren is not the point. The point is that the signal reaches a UL-listed monitoring center whether or not anyone is around to hear it. A local siren in an empty industrial park tells nobody.
Verified response. An alarm that arrives with live video of someone on site gets treated differently than a plain signal. It also cuts out most false dispatches.
Move the climbing aids. Ladders, pallets, dumpsters and stacked material next to a wall are a staircase to your roof. Moving them costs nothing.
What this means for your budget
Line up the pattern. Most break-ins happen at the back of the building. They come through a door or a window. There is no safe hour. And only one in six ends in an arrest.
Given all that, another indoor camera is rarely the best next dollar.
Better order: light the perimeter, cover the approach, put contacts on every exterior opening including roof hatches and overhead doors, and buy monitoring that produces a verified response.
That sequence follows where break-ins actually happen, not where cameras are easiest to hang.
Track your own numbers
National data gives you context. Your own history gives you priorities.
Log every break-in and near miss at your property. Write down the date, the time, the spot, how they got in or tried to, and what was taken or damaged.
Two years of that log will tell you more than any national figure, in a down year or an up one.
Read the data carefully
Three cautions belong in any conversation about these numbers.
Not every break-in gets reported. Plenty go unreported, especially when the loss falls under the deductible or the owner expects nothing back. Nationally, only about 30.5 percent of property crime victims told police in 2024. So treat every figure here as a floor, not a total.
Cities and states do not count the same way. Agencies use different standards and different systems. Michigan’s MICR program collects full detail on 107 offenses. The federal NIBRS standard it feeds collects full detail on 71. Comparing a Michigan county to an out-of-state county is shaky. Comparing your building to its own past is not.
Reporting changes year to year. The FBI adjusts what it publishes. The 2025 report dropped some breakdowns that appeared in 2024, which is why a few figures here carry an earlier date. Always check the year on any crime statistic you are handed.
FAQ
Are business break-ins going up or down?
Down, sharply. Break-ins fell an estimated 15.8 percent nationally from 2024 to 2025, and the rate hit a 20-year low. Michigan’s 2025 figures are not out yet. The state’s overall crime rate had already fallen 10.2 percent the year before.
How many break-ins happen in Michigan each year?
The newest state breakdown is 2024, showing about 19,000, or 13.4 percent of 141,493 property crimes. The state does not split that cleanly between homes and businesses. For a local count, use the Crime in Michigan dashboard.
If break-ins are falling, do I still need security?
A falling national rate does not lower the odds at any one building, and it does not lower the cost of a single incident. It also does nothing about repeat hits, which stay likely once a building has been opened once.
What time of day do break-ins happen?
More evenly than most people expect. In 2025 the afternoon block from noon to 6 p.m. led with 161,764, and the four six-hour blocks were within about 40,000 of one another. There is no safe window.
When should a Michigan business be most alert?
Late fall through winter. Early darkness and long holiday closures drive it. In Southeast Michigan that runs roughly November through March.
Does a security sign alone stop break-ins?
A sign has some deterrent value and no detection value. It is one layer, not a system.
Why do so few break-ins end in an arrest?
Case volume, thin evidence and limited investigators all play a part. Only 17.4 percent of reported property crimes were cleared in 2025. For an owner, the takeaway is simple. Prevention beats recovery.
Conclusion
Break-ins are at a 20-year low. That is real, and it is worth nothing to the one building that gets opened.
Plan from the pattern, not the trend line. Rear doors. Dark corners. Unlocked openings. And the weeks right after a break-in.
Guardian Alarm has protected Michigan businesses since 1930. To walk your building’s real approach points with someone, call 1.800.STAYOUT.
Source list
Kleemans, E.R., “Repeat Burglary Victimization: Results of Empirical Research in the Netherlands,” Crime Prevention Studies, Vol. 12. https://www.popcenter.org/content/crime-prevention-studies-volume-12-volume-12
FBI, Uniform Crime Reporting Program, “UCR Summary of Reported Crimes in the Nation, 2024,” released August 2025. https://cde.ucr.cjis.gov/LATEST/resources/reports/UCR%20Summary%20of%20Reported%20Crimes%20in%20the%20Nation%202024.pdf
FBI press release announcing the 2024 figures. https://www.fbi.gov/news/press-releases/fbi-releases-2024-reported-crimes-in-the-nation-statistics
USAFacts, “What is the crime rate in Michigan?” (FBI UCR 2024 state submissions). https://usafacts.org/answers/what-is-the-crime-rate-in-the-us/state/michigan/
USAFacts, “How have property crime rates changed over time?” https://usafacts.org/articles/property-crime-rates/
Average value of property stolen by burglary location, FBI Property Stolen and Recovered tables, 2023, as compiled by Statista. https://www.statista.com/statistics/252455/average-value-of-property-stolen-during-burglaries-in-the-us-by-location
Michigan State Police, MICR annual reports and Crime in Michigan dashboard. https://www.michigan.gov/msp/divisions/cjic/micr/annual-reports
Michigan State Police news release on the Crime in Michigan dashboard. https://www.michigan.gov/mspnewsroom/news-releases/2024/12/06/statewide-crime-visualization-tool-now-available-to-public
Michigan State Police, 2022 Crime in Michigan Annual Report (MICR versus NIBRS methodology). https://www.michigan.gov/msp/-/media/Project/Websites/msp/micr-assets/2022/MICR-Annual-Report-2022.pdf
ASU Center for Problem-Oriented Policing, “Step 29: Be ready for repeat victimization,” summarizing Pease and Farrell, “Once Bitten, Twice Bitten,” Home Office. https://popcenter.asu.edu/content/step-29-be-ready-repeat-victimization
ASU Center for Problem-Oriented Policing, “Analyzing Repeat Victimization.” https://popcenter.asu.edu/content/analyzing-repeat-victimization
